Por: Franklin Isaac Ormaza-González; Carlos Martillo-Bustamante; Elvis Espinoza; Jean-Noel Proust; François Michaud; Jean-Frederic Lebrun
1 Introduction
El Niño is a coupled ocean-atmosphere phenomenon characterized by interannual variability and non-periodic occurrences (McPhaden et al., 2006; Cai et al., 2015; Wang et al., 2017; Li et al., 2024; Islam, 2025; Vialard et al., 2025; Kent et al., 2025; and references therein). It typically originates in the central equatorial Pacific, specifically within region 3.4 (bounded by 5°N–5° S, 120°W–170°W, see BoM, 2025), where heat accumulates in the water column (Trenberth, 1997; Wang and Fiedler, 2006; OrmazaGonzález, 2016). This thermal anomaly is transported eastward by Kelvin waves, which elevate sea surface temperatures (SSTs) to 28– 29 °C and deepen the thermocline to depths of approximately 150 meters (Halpern, 1987; Garcés-Vargas et al., 2005). The resulting thermal expansion rises mean sea level (MSL) by over 40 cm in region 1 + 2 (0-10S, 80W-90W).
The development of El Niño significantly alters atmospheric dynamics. Westerly winds begin to dominate over the prevailing easterlies, and the redistribution of heat—mediated by far-west Kelvin waves—weakens the southern trade winds, thereby affecting the position of the Intertropical Convergence Zone (ITCZ). In regions 3 and 1 + 2 (BoM, 2025) the ITCZ shifts southward from its typical location near 5°N to latitudes around 5–10°S. This displacement enhances evaporation and promotes persistent cloud formation, creating a greenhouse-like environment that reinforces heat accumulation. As a result, SSTs, evaporation rates, and rainfall intensify across the coastal zones of Ecuador and northern Peru (Thielen et al., 2023).
These meteorological and oceanographic ENSO events have profound socio-economic impacts at local, regional, and global scales (Huang et al., 2025). For example, during the 1997–1998 El Niño event, losses in Ecuador exceeded $2 billion USD, with nearly 300 fatalities, widespread destruction of infrastructure, landslides, urban flooding, and severe damage to agricultural lands (Glantz, 2001). Nearly 121 years before this event, another event was recorded in 1877–1878, which caused enormous impact not only on the coasts of Ecuador and Perú but also intense droughts in Asia, South-East Asia, and Africa triggering deaths over 20 million people (Aceituno et al., 2009). More recently Huang et al. (2025) have demonstrated how ENSO events cause quakes in the worldwide energy market with collateral impacts.
A more detailed consideration of the oceanographic dynamics in Bahıa de Panamá ́ is essential to contextualize the broader circulation patterns described in this study. The annual upwelling event in the Gulf of Panamá, occurring between January and April, plays a critical role in modulating water masses and driving the transport of warmer waters toward the Equator. This process is closely linked to Atlantic tropical trade winds (Ordó ñez-Zú ñiga et al., 2021), which blow east to west across Panamá Bay and displace warm (27–29 °C) and relatively less saline (<30–32) surface waters (D’Croz. et al., 1991). These waters are advected southward along the coasts of Colombia, Ecuador, and northern Peru, shaping regional circulation and productivity patterns (Ormaza-GonzálezCedeño, 2017; Lübbecke et al., 2019).
Recent analyses confirm that the strength of these winds is fundamental to sustaining Panamá’s seasonal upwelling, with weakening events leading to suppression of nutrient−rich waters and cascading ecological impacts (O’Dea et al., 2025). Wind−driven dynamics generate strong upwelling that brings nutrients (N, P, Si) from deeper layers to the surface, enriching the trophic chain and sustaining high biological productivity (D’Croz. et al., 1991). Complementary studies emphasize the value of integrating remote sensing with in situ and biological data to capture these processes more effectively. For instance, satellite monitoring near Coiba Island enhances environmental and oceanographic assessments (Crawford et al., 2024), while meso−zooplankton have been highlighted as biological indicators of climate and oceanographic variability in the Coiba Archipelago (Brugnoli et al., 2023).
Historical evidence underscores their importance of these warm and less saline waters southward intrusions. The 1925 Coastal El Niño produced catastrophic flooding in northern Peru and Ecuador and is considered one of the strongest coastal warming events of the 20th century (Takahashi and Martınez, 2019́ ). More recently, the 2017 Coastal El Niño (January–April) was driven by sudden Panamá Bay intrusions, generating SST anomalies exceeding +2.6 °C and torrential rainfall across Ecuador and Peru. In Peru, the event caused more than 100 fatalities, displaced over 300,000 people, health issues and inflicted economic losses surpassing $3 billion USD (Echevin et al., 2018; Rollenbeck et al., 2022; Yglesias-González et al., 2023). Ecuador experienced extensive flooding in Guayas, Manabı, and́ Esmeraldas provinces, with severe agricultural losses in bananas, cacao, and rice, alongside widespread infrastructure damage. Importantly, Ormaza-González and Cedeño (2017) documented how Panamá Bay intrusions during this period produced rainfall and warming patterns similar to El Niño, reinforcing the need to consider these seasonal processes as independent drivers of coastal anomalies. These cases demonstrate that Panamá Bay intrusions can generate impacts comparable to major ENSO events, yet remain underrepresented in global monitoring frameworks.
In 2022, Ormaza−González et al. predicted the development of an El Niño event during 2023–2024. By early 2023, a rare and intense SST anomaly was observed along the coasts of Ecuador and Peru (Peng et al., 2024), prompting global agencies to declare El Niño conditions. In June 2023, NOAA confirmed El Niño based on the Oceanic Niño Index (ONI), with Kelvin waves propagating eastward and the Southern Oscillation Index (SOI) falling below -7. By September, both ONI and SOI exceeded thresholds and remained coupled for over five months, leading NOAA, BoM, and the UK Met Office to confirm the El Niño 2023–2024 event. By late December, the sixth consecutive warm Kelvin wave had reached region 1 + 2, accompanied by weakening trade winds and a southward−shifting ITCZ.
In December 2023, El Niño conditions prevailed, with ONI at 1.8 °C and sea surface temperature anomalies (SSTA) reaching 2.0 °C, classifying the event as strong. However, slight decreases in anomalies in the western equatorial Pacific were reported (MetOffice, 2024; NOAA, 2023), as cold waters began surfacing in the east. This apparent contradiction between global indices and local anomalies underscores the need to disentangle basin−scale ENSO signals from regional processes such as Panamá Bay intrusions — the central motivation for this study.
While ENSO dynamics have been extensively documented, with abundant literature spanning physical mechanisms, teleconnections, and socio-economic impacts, references addressing seasonal Panamá Bay intrusions remain comparatively scarce. Apart from a few regional studies (e.g., Ormaza-González and Cedeño, 2017; Echevin et al., 2018; Tan et al., 2024), the processes and impacts of Panamá Bay waters are underrepresented in global climate analyses, despite their capacity to generate catastrophic events such as the 1925 and 2017 Coastal El Niños, see Garreaud, (2018). This imbalance in the scientific record underscores the need for focused research on Panamá Bay intrusions, which can mimic or even amplify ENSO-like impacts but are often overlooked in monitoring frameworks.
The objective of this study is to disentangle the relative contributions of ENSO forcing and seasonal Panamá Bay intrusions to the anomalous coastal warming observed in 2023–2024. To achieve this, we present the first in situ oceanographic dataset of surface and vertical profiles extending to 2000 m depth along the easternmost equatorial Pacific margin, spanning the southern and northern coastal boundaries of Colombia and Ecuador. This dataset fills a critical observational gap in a historically under−sampled region and provides the basis for testing our central hypothesis: that the 2023–2024 coastal warming was primarily driven by Panamá Bay intrusions rather than ENSO, and that El Niño 2023–2024 did not impact region 1 + 2 as strongly as the benchmark events of 1982–1983 and 1997–1998.
Although not the primary focus of this study, we also present and briefly analyze deep temperature profiles and temperature– salinity (T/S) diagrams—datasets rarely available for this region. These observations underscore the chronic lack of high−resolution vertical oceanographic data in the eastern equatorial Pacific and provide critical context for disentangling El Niño−driven warming from seasonal Panamá Bay influences. In doing so, they establish a valuable baseline for future climate modeling, predictive frameworks, and coastal risk assessments.
2 Material and methods
2.1 In situ oceanographic and meteorological measurements
Surface Sea Temperature (SST), Salinity (S), Surface Air Temperature (SAT), wind speed and direction, atmospheric pressure (AP), and cloud cover were measured every two hours along the vessel’s track from January 8 to 29, 2024, totaling >250 in situ real time measurements (see Figure 1),. Cloud characteristics—including type, height, and coverage—were visually estimated following standard meteorological protocols. All measurements were conducted aboard the French research vessel Pourquoi pas? (Charcot, 1910), equipped with advanced oceanographic instrumentation (see vessel specifications at: https://www.ifremer.fr/en/flotte-oceanographique-francaise/ decouvrez-les-navires-de-la-flotte-oceanographique-francaise/lepourquoi-pas). The position of the Intertropical Convergence Zone (ITCZ) was monitored using freely available meteorological platforms, including wxcharts.com, which provided real-time synoptic maps and atmospheric overlays.
2.2 Vertical profiling and instrumentation
Vertical Sea Temperature (VST) profiles were obtained using Expendable Bathythermographs (XBTs; Sippican Deep Blue series, Lockheed Martin), with a precision of ±0.2 °C (IOC, 2018; Parks et al., 2022). Multiple XBT models were deployed depending on the vessel’s speed and target depth (0–2000 m); during this cruise, the R/V Pourquoi pas? maintained a maximum speed of 5 knots. A total of 37 XBT casts were conducted at designated stations (see Figure 1), spanning the northern Ecuadorian and southern Colombian coastal zones.
Geolocation and surface meteorological data were acquired from onboard instruments integrated into the vessel’s navigation and data acquisition systems. These included GPS, thermosalinographs, anemometers, barometers, and cloud observation protocols consistent with World Meteorological Organization standards.
2.3 Satellite and reanalysis data
To complement in situ observations, satellite-derived data from NASA’s Terra (EOS AM-1) and Aqua (EOS PM-1) platforms were used. These satellites carry the Moderate Resolution Imaging Spectroradiometer (MODIS), which provided temporal and spatial measurements of chlorophyll-a concentrations and the diffuse attenuation coefficient (Kd at 490 nm) during the study period. Additionally, reanalysis products were accessed via the Copernicus Marine Environment Monitoring Service (CMEMS), specifically the WIND_GLO_PHY_CLIMATE_L4_MY_012_003 dataset. This product includes climatological wind fields from January 1993 to 2025, enabling historical comparisons and anomaly detection.
2.4 Supplementary observations and navigation tracks
Supplementary regional meteorological and oceanographic insights were gathered from verified social media sources, including real-time observations shared by local agencies and research institutions during the cruise period. These informal data points were used to cross-reference in situ and satellite observations.
The Pourquoi pas? followed a predefined navigation track designed for seismic, bathymetric, and oceanographic profiling. These tracks closely mirrored those of previous cruises in the region (e.g., Michaud et al., 2015), ensuring continuity in spatial coverage and facilitating comparative analysis.

Figure 1. Tracks and the positions sites of continuous surface sampling (blue dots) and XBT launches (red stars) from the 8th to 29th of January. The sequential sampling was from south to north. Typical ship speed: 5 knots (2.57 m/s). Source: Authors’ own elaboration. Based on unpublished preliminary report; see also Michaud et al. (2024)
2.5 Data and graphic analysis
To complement the in situ measurements collected during the cruise, third-party datasets were incorporated to enhance spatial and temporal coverage. These included satellite observations, creanalysis products, and publicly available meteorological data (see Table 1 and references).
Spatial interpolation of oceanographic variables was performed using the Kriging method, a geostatistical technique widely applied in earth and environmental sciences. Kriging is particularly effective for interpolating irregularly distributed data when initial estimates or known autocorrelation structures are unavailable (Hansen and Poulain, 1995; Kusuma et al., 2018). The method leverages spatial dependence among observations to estimate values at unsampled locations, making it ideal for modeling continuous environmental fields from discrete point measurements (Le and Zidek, 2006).
Each variable—such as sea surface temperature, salinity, and wind speed—was sourced from distinct datasets, including in situ field measurements and satellite-derived or reanalysis products. These variables were individually interpolated using Kriging to generate continuous spatial maps suitable for comparative analysis across the study region. A summary of the interpolated variables and their sources is provided in Table 1.
2.6 Research area
The study area (see map) extends from 0° 0.24′ S to 2° 02′ N and from 79° 19′ W to 81° 12′ W, encompassing the southern coast of Colombia and the northern coast of Ecuador. This region is characterized by pronounced oceanographic and meteorological dynamics, and is also notable for its seismological activity and sediment biogeochemical processes.
2.7 Oceanographic and climatic dynamics
Surface ocean and coastal circulation in this region is primarily influenced by the Panamá Bight current system (0–9° N; 73–90° W), which comprises three major currents with typical velocities ranging from 0.1 to 0.5 m s-1 (see: earth:: a global map of wind, weather, and ocean conditions). These include:

TABLE 1 Summary of spatially interpolated variables. See links in reference section.
[1,2] https://data.marine.copernicus.eu/product/GLOBAL_MULTIYEAR_PHY_001_030/description
[3] https://data.marine.copernicus.eu/es/product/GLOBAL_MULTIYEAR_BGC_001_029/description
[4, 5]https://cds.climate.copernicus.eu/datasets/reanalysis-era5-single-levels-monthly-means?tab=overview
[6]https://data.marine.copernicus.eu/product/WIND_GLO_PHY_CLIMATE_L4_MY_012_003/description
[7]https://data.marine.copernicus.eu/product/MULTIOBS_GLO_PHY_TSUV_3D_MYNRT_015_012/description
[8]https://cds.climate.copernicus.eu/datasets/reanalysis-oras5?tab=overview
- The eastward-flowing North Equatorial Counter Current (NECC),
- The near-circular Panamá Bight Cyclonic Gyre (PBCG), The westward-flowing South Equatorial Current (SEC) (Chaigneau et al., 2006).
The west Pacific North Equatorial Countercurrent (NECC) has been shown to dramatically influence the impact of El Niño events (1987-1988) on the western coasts of Colombia, Ecuador, and Perú primarily. During 1982-1983, 1987-1988, 2009–2010 El Niño events, the NECC jet intensity proved to be decisive on the coastal impact (Wyrtki, 1973, Wyrtki, 1974; Zhao et al., 2013; Webb, 2018).
The South Equatorial Current (SEC) is a major westwardflowing surface current in the tropical Pacific Ocean, driven primarily by the trade winds. It transports warm, nutrient-poor waters across the equatorial region and plays a key role in upper ocean circulation and heat distribution. According to Chaigneau et al. (2006), the SEC exhibits complex spatial variability influenced by mesoscale structures and interactions with equatorial dynamics.
The PBCG—often referred to as the Panamá Bight Current— transports warm (>27 °C) and relatively low-salinity (32–33) surface waters to the northern coast of Ecuador (around 2° N). This influx triggers rapid coastal warming that can extend southward to southern Ecuador and northern Peru (3–5° S), as noted by Ormaza-González and Cedeño (2017). This phenomenon is also known in Perú as El Niño Costero (Ramırez and Briones,́ 2017; Espinoza-Morriberón et al., 2021) and typically occurs seasonally from January to April–May, depending on the strength of the Panamá Bight Current. Its impacts resemble those of the broader El Niño event.
Conversely, the northward-flowing Humboldt Current (Chaigneau et al., 2013) can extend beyond the equator, carrying cold waters (typically <19 °C) with salinity levels above 35. It predominates along the Ecuadorian coast from May to December. The interplay between the PBCG and the Humboldt Current defines two distinct seasons: a rainy season from January to April and a dry season from May to December, with precipitation levels significantly above or below average, respectively. These seasonal dynamics also affect marine productivity—diminished during the rainy season and enhanced during the dry season. When El Niño events reach the coasts of Ecuador and Peru, they often result in catastrophic, flood-inducing rainfall. Understanding the interplay between these oceanographic drivers is essential for distinguishing seasonal warming from El Niño-related anomalies—an objective central to this study.
El Niño is officially declared when Sea Surface Temperature Anomalies (SSTA) in region 3.4 (5° N–5° S, 120–170° W) exceed +0.5 °C for at least five consecutive months, accompanied by a Southern Oscillation Index (SOI) below −7 (Adamson, 2022). The accumulated thermal energy in this region is gradually transmitted eastward over 2–3 months via descending warm Kelvin waves, which elevate sea surface temperatures along the Ecuadorian coast. This is an interannual phenomenon.
3 Results
3.1 Meteorology
3.1.1 Surface air temperature
In situ SAT fluctuated around 26.5 ± 0.87 C ranging from 24.3C to 28.9C from southern to northern latitudes respectively. The distribution clearly shows an increasing SAT from south to north, the tongue-like distribution shows colder surface water intruding north coast as trade winds were blowing consistently from the south. Similar SAT pattern for same month 2024 is observed from data reported from 1940 to 2024, however the climatology shows colder SAT as it ranged from 25.9 C to 26.7 C, with a media value of 26.34C. The red dots at the same geographical position provided punctual STA, thus the most northern-southern values are 27.1 25.3 and 25.5 – 24.5 C for in situ and climatology data, respectively.
During January 2024, atmospheric pressure ranged from 1002.8 to 1011.1 hPa, showing a variation over 8.3 hPa with an average of 1007.3 ± 1.77 hPa. The lowest values were recorded in the north and the highest in the south. In contrast, the January climatological average for 1940–2022 exhibited slightly higher values, ranging from 1008.9 hPa in the south to 1011.3 hPa in the north; i.e, a difference of 2.4 hPa. Illustrative values (red dots) show in situ and climatological pressures of 1005.1 and 1010.8 hPa in the north, and 1008.2 and 1008.9 hPa in the south, respectively. Overall, in situ atmospheric pressure in 2024 was lower than the climatological average, though it followed the same spatial distribution pattern.
3.1.2 Surface winds
Wind speeds ranged from 0.41 to 11.47 m/s (0.8 to 22.3 knots), with an average of 5.6 ± 2.0 m/s. The lowest values were recorded in the southern coastal areas, while the highest occurred over the open ocean between 1°S and 1°N, west of 81°W. Overall, the strongest winds were observed north of Ecuador. Wind direction predominantly ranged from 200° to 320°, with a median value of 225° (Figure 2). In contrast, satellite climatological data from 1995 to 2024 reported a median wind speed of 3.61 ± 0.52 m/s (2.33–4.28 m/s), which is typical for this time of year, and showed a similar directional pattern. Notably, there is a marked difference of nearly 2.00 m/s between the in situ measurements and the climatological averages.
3.1.3 The Inter Tropical Convergence Zone and cloudiness
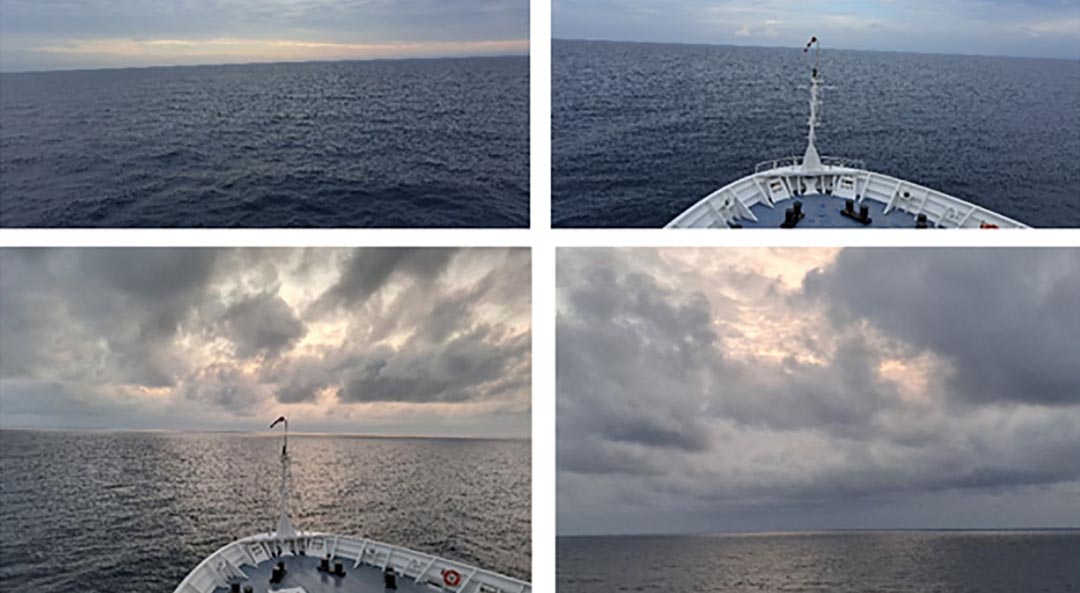
On average, throughout the cruise, skies were predominantly cloudy (6/8 coverage), with medium-altitude clouds (approximately 2000 m) consisting mainly of cumulus and fracto-stratus formations. On some days, cloud cover intensified into nimbostratus (see photos in Figure 3). Meanwhile, the most eastern southern flank of the Intertropical Convergence Zone (ITCZ) was monitored using freely available meteorological platforms such as wxcharts.com. It was generally located between 2°N and 3°N, occasionally shifting southward to nearly 1°N (see https://www.ventusky.com/?p=3.7;-85.3;4&l=rain-3h&t=20240113/ 1200, 10 January 2024).
3.2 Oceanography. In situ measurements
3.2.1 Sea surface temperature
Sea surface temperature (SST) ranged from 25.90 °C in the southernmost part of the study area to 28.60 °C in the north, revealing a distinct latitudinal gradient. A slight cooling trend was also evident from the coastal zone toward the open ocean (Figure 4, left). Isotherms between 27 °C and 28 °C were aligned parallel to the coastline, extending from south to north, with the 28 °C isotherms concentrated north of approximately 1.7°N. The lowest SST values were recorded near 1°S, between 81°W and 82°W.
Climatological SST data for January (Figure 4, right) showed the highest temperatures in the northeastern sector, around 26.5°C, gradually decreasing to approximately 26.0°C in the southern region. Notably, the isotherm distribution differed between the climatological averages and the in situ measurements from January 2024, with significantly warmer SSTs observed during the latter. For instance, SSTs reached 28.4 °C compared to 26.5 °C at the same location (see red dots), and 26.8 °C versus 26.0 °C in the southern portion.

Figure 2. Wind speed and direction. Left. In situ, January 2024. Right. Climatology 1995-2024. Direction in degrees (arrows).

Figure 3. Typical cloud cast from the 8th to the 29th of January. (A, B) cumulus stratus; (C, D) fracto stratus medium altitude (around 2000 m height). Credit:
Authors.
3.2.2 Sea Surface Salinity
Sea Surface Salinity (SSS) ranged from 29.60 to 32.79, gradually increasing from north to south, with an average value of 31.60 ± 0.78 (Figure 5, left). A localized low-salinity zone (~30.12) was identified near 2°N, where a tongue of fresher water extended southward, effectively separating coastal (eastern) from offshore (western) waters. Salinity increased westward across this boundary.
Climatological SSS data (1991–1994) from Copernicus revealed a broadly similar spatial pattern, with salinities (see red dots in Figure 5) ranging from approximately 32.10 in the north to a maximum of 33.00 in the south. Compared to in situ measurements, the northern values were over 2 units higher (in situ ~30.00), while southern values differed by less than 0.71. This indicates a pronounced salinity gradient from south to north.
3.2.3 Deep vertical distribution of temperature and salinity
This study presents the first reported vertical profiles of temperature and salinity in the eastern equatorial Pacific, based on 37 XBT casts (see Figure 1 and SM1 for geographical positions).
All profiles exhibited the classic vertical structure characteristic of tropical oceanic waters. The Pp5 profile (see Figure 1) at the southern latitude, illustrates a representative distribution down to 100 m depth. The mixed layer, defined following Johnson and Lyman (2022), extended to approximately 10 m. A pronounced thermocline was observed between 16 m and 41 m, with a temperature gradient of 0.33°C/m, followed by a more gradual decline to 100 m. Salinity within the mixed layer varied slightly, ranging from 33.64 to 34.03.
In general, below the surface layer, temperature decreased progressively: reaching ~15°C at 200 m, ~10°C between 400–500 m, and ultimately 2.29 °C at 2000 m (Figure 6). In contrast, salinity remained relatively constant at 35.00 from 50 m downward,however slightly lower salinity below 1000 m was found in deep
profiles down to 2000 meters. These profiles represent the deepest temperature measurements reported for this region.
3.2.4 Deep latitudinal profiles of thermal structure
Figure 7 presents four latitudinal transects derived from XBT data, illustrating the vertical distribution of the 28–27 °C isotherms. These isotherms reach their greatest depth in the northernmost profile (A), descending to approximately 30–35 m, while in the southern profile they shoal to less than 12 m. Along transect B, the isotherms rise to around 20 m before deepening again to nearly 30 m in profile C, indicating pronounced spatial variability in thermal stratification.
The steep thermal gradients observed in profile D suggest active vertical mixing, likely driven by turbulent processes. In contrast, profile C—located near the equatorial line—exhibits signs of downward displacement of surface waters, resulting in a deepened mixed layer. This feature coincides with reduced wind intensity at this latitude, which may have facilitated the southward intrusion of warm waters from Panama Bay. Profile B, meanwhile, appears to reflect an upward displacement of subsurface waters, contributing to a shallower mixed layer and the emergence of 20°C waters at relatively shallow depths.
Further north, profile A again shows evidence of Panama Bay water intrusion, like the pattern observed in profile C. It is important to note that the whole dataset was not collected in real time; there is a temporal gap of approximately 20 days between the southernmost and northernmost profiles, which may influence the observed variability.
Figure 8 shows longitudinal vertical profiles along three latitudes from 0 to 1000 meters. Overall, the isotherms show highly stratified water columns below 50–70 meters depth, although there is a slight vertical displacement between isotherms 5–10 C indicating presence of distinct water masses, probably the Antarctic Intermediate Water (AAIW), specifically the South Pacific subtype (Bostock et al., 2013). It is well known the AAIW is part of the global thermohaline circulation, which moves water masses across vast distances. The AAIW is advected northward via the Peru-Chile Undercurrent and the Equatorial Undercurrent system. Also, the complex bathymetry of the eastern Pacific, including ridges and continental slopes, can steer AAIW northward.
3.2.5 Mixed layer and the vertical 20 °C isotherm
During January 2024, the horizontal distribution of the mixed layer depth (MLD) and the 20 °C isotherm (Figure 9) reveals distinct spatial variability across the study area. The MLD averaged 22.4 m, ranging from 6.1 m to 40.7 m. Shallowest thermocline was between 1S and just below the equatorial line; a second shallow core was at 1N. The deepest mixed layers or thermoclines were observed near the northern part of the equatorial line and the coastal region (approximately 0.0 to 0.5°N), suggesting enhanced vertical mixing or wind-driven processes in these areas, where the highest wind speed was measured. The 20°C isotherm was located at an average depth of 37.9 m, spanning from 10.1 to 56.6 meters depth. Concurrently, the core of the deepest 20°C isotherm coincided with the corresponding deeper thermocline, similar pattern occurred with shallow thermocline and 20 C isotherms. The spatial distribution of gradients suggests surface advection processes from north to south and vice versa on a wave like movement.

Figure 4. Sea Surface Temperature (SST). Left. In situ data taken. Right Climatology (1993-2021), from Copernicus. Red dots are at the same geographical position in both graphs.
3.2.6 Water masses
Temperature-Salinity (T-S) diagrams revealed the presence of distinct water masses during the sampling period. As shown in Figure 10, three principal water masses were identified at the northernmost sampling site: Panamá Bay Water, Humboldt Current Water, and Deep Pacific Water (see e.g., Peters et al., 2018). Among these, Panamá Bay Water was the most prominent, occupying the surface layer and extending several meters downward throughout the study area. This water mass is characterized by elevated temperatures and reduced salinity, consistent with its coastal origin and influence from tropical surface waters.
In contrast, Humboldt Current Water and Deep Pacific Water were confined to greater depths and exhibited more localized distributions, suggesting limited vertical mixing and a stratified water column during the observation period. At approximately 1000 m depth, the T-S correlation indicated a density exceeding 1.027 g/cm³, consistent with the presence of Antarctic Intermediate Water (AAIW), specifically the South Pacific subtype (Bostock et al., 2013). Above this layer, a water mass with salinity near 35 and temperatures around 15 °C was observed, likely associated with the westward-flowing South Equatorial Current (SEC) and the subsurface extension of Humboldt Current waters. As the characterization of water masses was not a primary objective of this study, the full set of temperature-salinity profiles (32 in total) is provided in the Supplementary Material. This dataset constitutes the first reported T-S observations for this region of the eastern tropical Pacific.
4 Discussion
The comparison between in situ meteorological data and satellite-derived estimates from the Copernicus platform reveals measurable inconsistencies across the study area. Air temperature differences were generally within ±0.5°C, with localized deviations reaching up to 1.0°C in the northern sector. These discrepancies fall within the expected range reported by Li et al. (2013) and are likely attributable to sharp thermal gradients, variable cloud cover, and atmospheric heterogeneity. Notably, the southern edge of the Intertropical
Convergence Zone (ITCZ) was present in the northern portion of the study area, potentially influencing local temperature dynamics.
Wind speed comparisons between in situ and satellite-derived data showed more pronounced variability, with differences ranging from −2 to +4 m/s. These spatially heterogeneous discrepancies can be attributed to limitations in satellite retrieval techniques— particularly scatterometers and altimeters—which are sensitive to rain, surface roughness, and land contamination near coastal zones. Additional contributing factors include algorithmic uncertainties, spatial mismatches, and short-term local variability that satellites may fail to capture (Kent et al., 2012; Mitsopoulos and Peña, 2023). Despite these differences in magnitude, wind direction remained consistent across datasets, averaging approximately 225°.
Regarding sea surface temperature and sea surface salinity, observed differences ranged from −0.6 °C to +0.3 °C for SST and approximately ±0.5 units for SSS. Notable anomalies included SST minima of −1.0 °C in the southern region and SSS maxima of +1.0 in the north. SST discrepancies are primarily due to the depth of in situ sensors (>1 m), which measure bulk temperature, whereas satellite sensors detect skin temperature at the surface. Additional sources of error include cloud and atmospheric contamination (e.g., humidity, aerosols, suspended particles), temporal mismatches, diel variation, and differences in spatial resolution (Margaritis et al., 2025).
Despite the overall coherence between in situ and satellite-derived datasets—both internally across variables and externally with established literature—the presence of localized discrepancies highlights inherent

Figure 6. Deep vertical profile pP28 at: 1 0’N, 80 21’W, (see SM1). 20/01/2024.
limitations in spatial resolution, sensor depth sensitivity, and retrieval algorithms. These constraints, particularly evident in coastal and dynamically variable regions, underscore the need for cautious interpretation and the continued integration of multi-source observations to enhance the reliability of ocean-atmosphere assessments.
4.1 Evidence for the occurrence of El Niño in 2023-2024
The longest La Niña event since 1920—or at least since 1954—was La Niña 2020–2023 (Ormaza-González, 2023). The year 2022 ended with a well-established La Niña phase, and during the first days of January 2023, sea surface temperature (SST) anomalies (°C) were recorded as follows: -0.7 in El Niño 4, -0.8 in 3.4, -0.7 in 3, and -0.8 in 1 + 2 (see Table 2). Additionally, the Oceanic Niño Index (ONI) registered -0.7 °C, while the Multivariate El Niño Index (MEI, 2024) showed values of -1.1, -0.9, and -0.8 from January through March. Moreover, the Southern Oscillation Index (SOI) exceeded +20 (see BoM, 2025). These oceanographic and meteorological indicators were strongly coupled and fully consistent with La Niña conditions, which were expected to persist at least through the first quarter of 2023. During this same period, the Pacific Decadal Oscillation (PDO, 2024)—often described as a long-lived El Niño-like pattern of Pacific climate variability (Zhang and Levitus, 1997; Folland et al., 2002)—continued to oscillate around negative values. From January 2019 (-0.07) to July 2025 (-4.00), the PDO reached its lowest value since records began in 1854.
Beginning in March 2023, rapid surface warming developed along the equatorial Pacific. By the beginning of June sea surface temperature (SST) anomalies in region 3.4 surpass the boundaries of 0.5C, registering 0.8C, from there to the end of December, 2.0°C, while in region 1 + 2, 1.6°C (Table 2). The Oceanic Niño Index (ONI) registered -2.0 °C, and the Southern Oscillation Index (SOI) dropped below -7. These values clearly indicated the onset of a strong El Niño event, officially declared in September by various agencies including NOAA, the UK Met Office, and the Bureau of Meteorology (BoM). This event had been anticipated to some extent by Ormaza-González et al. (2022).
4.1.1 January: 2024 vs 1998
The 1997–1998 El Niño event remains the most significant and intense episode recorded since 1950 (Enfield, 2001), and is widely considered the strongest of the 20th century (Changnon, 2000; CPC, 2025). During its peak from October 1997 to January 1998, the Oceanic Niño Index (ONI) and Multivariate ENSO Index (MEI) reached values between 2.0 and 2.4, averaging 2.2°C (Thielen et al., 2023). Concurrently, in region 1 + 2 and along the western coast of South America, anomalous sea surface temperatures (ASST) exceeded 5°C, accompanied by sea level anomalies of approximately 30 cm, with maxima observed in December and January (Carr et al., 2002). These thermal anomalies, along with SSTs reaching 27–28°C, suggest the onset of the rainy season, weakening of trade winds, and deepening of the mixed layer and 20°C isotherm to depths of at least 50 m and 70 m, respectively.
Also, sea level anomalies 20–25 cm above normal, and the Intertropical Convergence Zone (ITCZ) shifted southward, positioned at or below the equatorial line.

Figure 7. Latitudinal vertical profiles (1-100m). A: 1.49N-1.99N; B: 0.91N-1.16N; C: 0.01S – 0.40N; and D: 0.89S – 0.28S. The XBT launch codes are at the top
of each graph.
Conversely, January 2024 exhibited ONI and MEI values averaging 1.9°C and 0.90°C, respectively, with SSTA in region 1 + 2 ranging from 0.8°C to 1.0°C (CPC, 2025). Notably, five downward-propagating Kelvin waves had already reached the eastern Pacific coasts, while an upward Kelvin wave was observed departing from the western Pacific in December.
Meteorological conditions in January 2024 contrasted sharply with those observed during the peak of the 1997–1998 El Niño event. During the latter, winds predominantly blew from the northeast at an average speed of 3.58 ± 0.83 m/s (Figure 11), reflecting a near-complete collapse of the trade wind system. The Intertropical Convergence Zone (ITCZ) had shifted southward, positioned between 2°S and 5°S, while SAT across the region consistently exceeded 27 °C.
Oppositely, January 2024 recorded an average wind speed of 5.6 ± 2.0 m/s, with ranging from 0.4 m/s to 11.4 m/s and a predominant wind direction from the southwest (∼220°; Figure 11). Another mark during the 2023–2024 event was the intensification of the Pacific anticyclone since September 2023, which led to a reinforcement of the trade winds across the equatorial Pacific. The Southern Pacific Anticyclone, has remained anomalously strong since 2020 (Li et al., 2023; Zhang et al., 2024). During this month, the anticyclone exhibited elevated pressure values (>1025 hPa, Figure 12) and an expanded core area relative to climatological norms (Ormaza-González, 2024). This subtropical system plays a critical role in modulating regional precipitation and cloud cover, often suppressing convective activity near its center. Its sustained strength reinforced the trade winds, potentially reflecting a lagged response to prolonged wind forcing or the unprecedented crossequatorial southerly wind anomalies observed during the 2020–2023 triple-dip La Niña. These anomalies originated in the southeastern tropical Pacific and persisted through January 2024.

Figure 8. Longitudinal vertical profiles along three latitudes from 0 to 1000 meters. The XBT code is at the top. See Figure 1 and SM1 for geographical position.

Figure 9. In situ mixed layer depth (left), and 20C isotherm depth (right) during January 2024
TABLE 2 SST anomalies (C) examples in 2023 for different El Niño regions. Niño 1 (far eastern equatorial Pacific): 5–10°S, 90–80°W, Niño 2 (fareastern equatorial Pacific): 0–5°S, 90–80°W, Niño 3 (eastern equatorial Pacific): 5°N–5°S, 150–90°W, Niño 3.4 (central equatorial Pacific): 5°N–5°S,170–120°W, Niño 4 (western equatorial Pacific): 5°N–5°S, 160°E–150°W.

Meanwhile, the Intertropical Convergence Zone (ITCZ) experienced a notable northward displacement, with its core firmly positioned between 2°N and 3°N —significantly farther north than its climatological average for this time of year (Ormaza-González and Cedeño, 2017). This shift was accompanied by a strengthened trade wind system, although its spatial and directional characteristics differed from those observed during the 1998 El Niño event. Seasonal rainfall intensity during El Niño or La Niña episodes is influenced not only by sea surface temperatures (SSTs) but also by the latitudinal position of the ITCZ (Fahrin et al., 2024). In January 2024, despite SSTs exceeding 27 °C along the Ecuadorian coast (approximately 1.8°N to 2.5°S), rainfall was markedly below average. For instance, Guayaquil—a key reference city for assessing El Niño impacts—recorded only 114 mm of rainfall, well below its typical January average of over 200 mm. This rainfall deficit is attributed to the ITCZ’s anomalously northern position, which limited convective activity over the region. In contrast, during the strong El Niño events of 1982–1983 and 1997– 1998, Guayaquil received 6210 mm and 5990 mm of rainfall, respectively (see, ERAS 2025), whereas the 2023–2024 event yielded only 1340 mm for the entire season. These observations underscore the distinct atmospheric dynamics of the 2023–2024 event, highlighting its divergence from canonical El Niño patterns.
The surface air temperature in 1998 was also higher than that registered in 2024; 27.18 ± 0.13 and 26.53 ± 0.87 in the same order, with maxima of 27.18 and 28.60; and minima of 26.83 and 24.30, respectively. On average they were similar, but ranges were dissimilar in about 0.35 and 4.3 C making air masses consistently higher SAT in 1998, therefore enhancing humidity and precipitation (Marsh, 2011), which did not occur in 2024.
Sea surface temperature (SST) patterns further underscored the divergence between the 1998 and 2024 conditions. In January 1998, SSTs decreased latitudinally from south to north, ranging from 28.02°C to 27.69°C, with a regional average of 27.90 ± 0.11 °C (Figure 13). During the development of the 2023–2024 El Niño, Saltos-Aguilar and Ormaza-González (2023); CNP (2023) reported observational data from monthly cruises conducted along the entire Ecuadorian coast, spanning approximately 3°S to the equator—within region 1 + 2 (90° W–80°W, 0°–10°S). SST measurements in the southern sector (Gulf of Guayaquil) and northern sector were as follows:
- July: 27.8°C in both regions
- August: 25.6°C (south), 27.2°C (north)
- September: 25.8°C (south), 25.2°C (north)
In January 2024, SSTs exhibited a broader latitudinal gradient, ranging from 25.90 °C in the south to 28.60 °C in the north, with a slightly lower regional average of 27.49 ± 0.63 °C. This reversal in the latitudinal SST gradient, along with increased variability, supports the presence of relatively stronger trade winds and altered oceanatmosphere coupling during the 2024 event. Moreover, SST distribution and values in 2024 closely resembled climatological patterns (Figure 4), suggesting a return to seasonal norms.
Sea surface salinity (SSS, Figure 13) in January 1998 showed a slight increase from north to south, ranging from 30.73 to 31.34, with an average of 31.07 ± 0.18. In contrast, SSS in January 2024 was notably higher, increasing from 33 to 34 across the same latitudinal gradient. The horizontal distribution of isohaline contours was conspicuously different. Specifically, low-salinity water masses originating from Panamá Bay (Alory et al., 2012) appeared to intrude southward into regions typically characterized by higher salinity. This pattern mirrored the climatological SSS distribution (Figure 4), further indicating that January 2024 reflected a seasonal configuration rather than a pronounced El Niño signal.
Taken together, these variables suggest that oceanographic conditions in early 2024 were more consistent with climatological expectations, and no strong impact from the 2023–2024 El Niño event was evident.

Figure 10. T-S diagram at the most northern sampling site. (Pp33, see Figure1,
MS1 geographical position). Ellipses: Yellow, near-circular Panamá Bight Cyclonic Gyre (PBCG) waters. Green, Humboldt current waters. Blue, deep ocean waters (Including AAIW). See SM2 for all XBT profiles.
4.2 Mixed layer depth and 20 C isotherm variability
The depth of the thermocline, or mixed layer, typically increases during El Niño events, often beginning in December or even November. Historical records from the 1982–1983 and 1997–1998 El Niño episodes indicate mixed layer depths (MLD) exceeding 100 m (Mangum et al., 1986; Cucalon, 1987; Enfield, 2001), suggesting strong surface stratification during periods of pronounced impact along the Ecuadorian and Peruvian coasts. Notably, in those events, the deepening of the MLD and the 20 °C isotherm began later in the preceding year.
In contrast, during the 2023–2024 El Niño, in situ measurements taken through November offshore the Ecuadorian coast revealed MLD values ranging from 10 to 14 m between 2.5°S and 0.5°N along 81°W longitude, corresponding to area 1 + 2. By January 2024, the spatial distribution of the MLD showed partial alignment with the January climatology (1993–2022), though it was generally deeper than the climatological range of 13 to 19 m (Figure 14). A prominent nucleus centered near 0.5°S, between 81.0° and 80.5°W, was observed in 2024 but is absent from the climatological pattern. The northern core around 1°N appears in both datasets, though it was deeper in 2024. Overall, the January 2024 thermocline was deeper than the climatological average, except in the southern region where it was comparatively shallower. By February 2024, the MLD had shoaled by approximately 7 m near 2°S (Bustos Oña et al., 2024), supporting the conclusion that the southward influence of the Humboldt Current effectively blocked the intrusion of warm waters from Panamá Bay.

Figure 12. The AP isobaths for January 2024 and average climatology for the month of January. Graphics are constructed with Copernicus Data.

Figure 13. SSS and SST distribution of January monthly averaged in the area researched during January 1998.
The depth and spatial distribution of the 20 °C isotherm revealed notable differences among the climatology, 1998, and 2024 datasets, both in absolute values and isoline configuration. The prominent nucleus centered near 0.5°S, between 81.0° and 80.5°W, was observed in 2024 but is absent from the climatological pattern. The northern core around 1°N appears in both datasets, though it was deeper in 2024. Overall, the January 2024 thermocline was deeper than the climatological average, except in the southern region where it was comparatively shallower. By February 2024, the MLD had shoaled by approximately 7 m near 2°S (Bustos Oña et al., 2024), supporting the conclusion that the southward influence of the Humboldt Current effectively blocked the intrusion of warm waters from Panamá Bay.
The depth and spatial distribution of the 20 °C isotherm revealed notable differences among the climatology, 1998, and 2024 datasets, both in absolute values and isoline configuration. The climatological pattern features isolines between 30 and 42 m depth (Figure 15), generally aligned parallel to the coastline. In January 1998 (Figure 15), the isotherm extended offshore to depths of up to 115 m, with shallower values around 50 m near the coast. This configuration suggests a horizontal thermal gradient indicative of reduced vertical mixing, increased stratification with distance from land (Enfield, 2001), thermocline tilt, regional circulation features, and the influence of broader oceanic processes across the central-eastern equatorial Pacific.
In contrast, January 2024 exhibited two distinct nuclei of maximum depth—approximately 55 m—located in the southern and northern portions of the study area. These features formed a wave-like pattern, consistent with the spatial distribution observed in the MLD. Despite the presence of a subsurface thermal nucleus— which may indicate localized upwelling as surface waters moved northward near 1°S—the overall vertical structure of the water column during the cruise reflected seasonal conditions rather than anomalous El Niño-driven dynamics.
Furthermore, the subsurface salinity and temperature profiles support the hypothesis that, at the time of observation, the strong 2023–2024 El Niño did not exert a measurable impact on coastal subsurface stratification. Consequently, both sea surface temperature (SST) and sea surface salinity (SSS) suggest the absence of a significant El Niño signal along the Ecuadorian coast during early 2024.
4.3 Vertical distribution and water masses
Oceanographic and meteorological variability in the study region during January 2024 strongly suggest that surface conditions were predominantly influenced by the seasonal intrusion of Panamá Bay waters from the north and the counteracting presence of the Humboldt Current from the south. These opposing forces establish a dynamic convergence zone between the equator and northern Ecuador.
Hydrographic data indicate that Panamá Bay water—extending longitudinally from 85°W to 90°W and latitudinally from 5°N to 5°S— is characterized by sea surface salinities (SSS) below 33 and sea surface temperatures (SST) exceeding 28 °C. This water mass was observed in the northern portion of the study area, penetrating southward to approximately the equatorial line.
Deeper water masses, such as Antarctic Intermediate Water (AAIW), were detected as far north as approximately 2°N. According to Bostock et al. (2013), this corresponds to the South Pacific subtype, identified at around 1000 m depth. Temperaturesalinity (T-S) correlations indicate a density exceeding 1.027 g/cm³. The primary drivers of AAIW presence in these latitudes include:

Figure 14. Spatial distribution of the mixed layer and 20C vertical isotherm depth climatology from 1993 to 2022.
1. Meridional Overturning Circulation (MOC). The AAIW is part of the global thermohaline circulation, which moves water masses across vast distances. After forming near the Antarctic Polar Front, AAIW travels northward along western boundary currents and interior pathways, eventually crossing the equator.
2. Western Boundary Currents.

Figure 15. Spatial distribution of the mixed layer and 20C vertical isotherm depth during January 1998.
In the South Pacific, AAIW is advected northward via the PeruChile Undercurrent and the Equatorial Undercurrent system. These currents help funnel intermediate waters toward the equator and beyond.
- Equatorial Upwelling and Mixing.
Near the equator, strong upwelling and vertical mixing can bring intermediate waters closer to the surface. This mixing allows
AAIW to influence nutrient and carbon dynamics in equatorial regions.
- Diapycnal and Isopycnal Mixing.
Turbulent mixing across density surfaces (diapycnal) and along them (isopycnal) helps redistribute AAIW across latitudes. These processes are especially active in the equatorial Pacific due to high energy from wind and tidal forces.
- Topographic Steering.
The complex bathymetry of the eastern Pacific, including ridges and continental slopes, can steer AAIW northward. These features guide water masses along preferred pathways, sometimes funneling them into equatorial zones.
Deeper, colder, and nutrient-rich water masses—and the dynamics that govern them—are essential to understanding ENSO-driven variability in deep ocean circulation across the Southeast Pacific. Recent findings by Torres-Godoy et al. (2025) demonstrate that interannual fluctuations in the transport of Antarctic Intermediate Water (AAIW) are intricately linked to ENSO phases, highlighting a dynamic coupling between intermediate-depth processes and surface climate variability. Complementary research by Wang et al. (2023) examined the combined influence of the Southern Annular Mode (SAM) and ENSO on Antarctic sea ice, suggesting that variations in AAIW formation—modulated by these climate modes—can extend their impact into tropical latitudes, thereby shaping surface ocean conditions. Furthermore, Dou and Zhang (2023) reported a weakening in the relationship between ENSO and Antarctic sea ice, and by extension AAIW, over recent decades, indicating a potential shift in the mechanisms that connect deep ocean circulation with surface climate dynamics.
4.4 Chlorophyll-a and surface currents
Further evidence that the 2023–2024 El Niño event did not produce significant coastal impacts in the study region comes from the analysis of Chlorophyll-a (Cl-a) concentrations, a key indicator of primary productivity and the foundation of the marine trophic chain. Cl-a data was used alongside surface current observations to assess oceanographic conditions. In tropical regions, Cl-a variability is closely tied to physical processes: elevated concentrations typically result from cold, nutrient-rich upwelling, while reduced levels are associated with warm, oligotrophic waters depleted in essential nutrients such as nitrogen, phosphorus, silicate, and trace micronutrients.
The productivity of Ecuadorian coastal waters is primarily governed by the seasonal dominance of northward and southward currents, which prevail from June to November and December to May, respectively (Chinacalle-Martınez et al., 2021́ ). While El Niño and La Niña events are known to exert significant influence on trophic dynamics, neutral or seasonally driven conditions tend to maintain a stable trophic structure.
In January 2024, satellite-derived Cl-a concentrations were notably higher than those recorded in January 2023, despite the latter occurring under La Niña conditions (Figure 16). This finding is consistent with previous hydrographic and atmospheric observations and is further supported by surface current data from Copernicus satellite products, which indicate a predominantly northward flow during January 2024—mirroring the circulation patterns observed throughout the 2020–2023 tripledip La Niña period.
5 Conclusions
The comparative analysis between in situ meteorological and oceanographic measurements and Copernicus satellite estimates demonstrates that both sources are broadly reliable, though each carries inherent limitations. Localized discrepancies in air temperature, wind speed, sea surface temperature, and salinity highlight the indispensable role of sustained, high−frequency in situ sampling, particularly in regions shaped by sharp and dynamic gradients and the Intertropical Convergence Zone.
These findings underscore the complementary nature of field and remote sensing approaches. In situ datasets provide essential validation and context for satellite observations, while satellites extend spatial coverage and enable long−term monitoring. The integration of these methods enhances confidence in ocean−atmosphere assessments and strengthens predictive frameworks for climate variability in the eastern equatorial Pacific.
Despite its classification as a strong El Niño, the 2023–2024 event did not produce the expected coastal impacts along the eastern Pacific. Subsurface thermal and salinity structures remained within seasonal norms, and the mixed layer depth and 20 °C isotherm showed no signs of the anomalous deepening typically associated with canonical El Niño events. The intensification of the Pacific anticyclone and reinforced trade winds since September 2023 further suggest atypical atmospheric dynamics.
Oceanographic observations confirm that local processes dominated. Mixed layers remained shallow, salinity and temperature gradients reflected Panamá Bay intrusions and Humboldt Current influence, and no basin−wide anomalies were detected. A particularly novel finding was the serendipitous detection of Antarctic Intermediate Water (AAIW) as far north as 2°N. This highlights the importance of deep vertical profiling of temperature and salinity, an area often overlooked in ENSO studies that focus primarily on surface variability. The observed T/S relationships underscore how intermediate waters connect high−latitude climate models with tropical ocean conditions, revealing the complexity of deep ocean–surface climate linkages in the Southeast Pacific.
Biological and meteorological indicators reinforce this divergence. Chlorophyll−a concentrations and surface current patterns in January 2024 resembled those typical of neutral or La Niña conditions, likely reflecting residual influence from the 2020– 2023 triple−dip La Niña. Rainfall also remained near seasonal averages: in Guayaquil, January–April totals were ~1340–1500 mm, far below the ~6000 mm recorded during the extreme 1982–1983 and 1997–1998 El Niño events. Although the northern coast experienced above−average precipitation, it did not approach the extreme levels characteristic of strong eastern Pacific El Niño events.
A rigorous, multi−layered approach—integrating meteorology, oceanographic in situ surface observations, satellite monitoring, and deep vertical profiling—provides the most reliable pathway to capture this complexity. Establishing such epistemic clarity is essential for anticipating impacts, informing policy, and safeguarding coastal societies that depend on accurate knowledge of ocean dynamics.

Figure 16. Chlorophyll-a content during January 2023 (left) and 2024 (right).
Data availability statement
The original contributions presented in the study are included in the article/Supplementary Material. Further inquiries can be directed to the corresponding author.
Author contributions
FO-G: Conceptualization, Methodology, Formal Analysis, Writing – review & editing, Supervision, Validation, Writing – original draft, Investigation. CM-B: Visualization, Data curation, Software, Resources, Writing – review & editing. EE: Writing – review & editing, Software, Data curation, Visualization, Formal Analysis. J-NP: Writing – review & editing, Resources, Funding acquisition, Project administration. FM: Supervision, Writing – review & editing, Resources, Funding acquisition, Project administration. J-FL: Data curation, Formal Analysis, Software, Resources, Investigation, Writing – review & editing.
Funding
The author(s) declared that financial support was not received for this work and/or its publication.
Acknowledgments
We gratefully acknowledge the reviewers for their supportive, encouraging, and constructive comments, which greatly improved the quality of this manuscript. Data were acquired in 2024 during the IRD-CNRS oceanographic campaign SUPER-MOUV on board the French oceanographic research vessel Pourquoi Pas?. This work was carried out in the framework of the collaboration between the CNRS-INSU, IRD, IFREMER and ESPOL, Nice, Rennes, Antilles and Sorbonne Universities, and ANR Fluid2Slip (Audrey Galvé). We thank the captains (Philippe Moineaux and Pierre-Yves Le Maer) and the crews of R/V Pourquoi pas? for their efficient work. Thanks to the French Embassies in Ecuador and in Colombia and INOCAR for their help before and during the cruise. We thank the SUPER-MOUV Science Party for their help in gathering and processing the data during the campaign and for the fruitful scientific discussions onboard and at different stages afterwards. We also thank the Maritime Faculty of ESPOL (FIMCM-ESPOL), for the support in different ways.
Conflict of interest
The authors declared that this work was conducted in the absence of any commercial or financial relationships that could be construed as a potential conflict of interest.
Generative AI statement
The author(s) declare that Generative AI was not used in the creation of this manuscript.
Any alternative text (alt text) provided alongside figures in this article has been generated by Frontiers with the support of artificial intelligence and reasonable efforts have been made to ensure accuracy, including review by the authors wherever possible. If you identify any issues, please contact us.
Publisher’s note
All claims expressed in this article are solely those of the authors and do not necessarily represent those of their affiliated organizations, or those of the publisher, the editors and the reviewers. Any product that may be evaluated in this article, or claim that may be made by its manufacturer, is not guaranteed or endorsed by the publisher.
Supplementary material
The Supplementary Material for this article can be found online at: https://www.frontiersin.org/articles/10.3389/fmars.2025.1737039/ full#supplementary-material
References
Adamson, G. (2022). El Niño without ‘El Niño’? Path dependency and the definition problem in El Niño Southern Oscillation research. Environ. Plann. E.: Nat. Sp. 6, 2047– 2070. doi: 10.1177/25148486221120546
Alory, G., Maes, C., Delcroix, T., Reul, N., and Illig, S. (2012). Seasonal dynamics of sea surface salinity off Panama: The far Eastern Pacific Fresh Pool. J. Geophys. Res.: Ocean. 117, C04028. doi: 10.1029/2011JC007802
BoM (2025). Available online at: http://www.bom.gov.au/climate/enso (Accessed September 30, 2025).
Bostock, H. C., Sutton, P. J., Williams, M. J., and Opdyke, B. N. (2013). Reviewing the circulation and mixing of Antarctic Intermediate Water in the South Pacific using evidence from geochemical tracers and Argo float trajectories. Dp. Sea. Res. Part I.: Oceanogr. Res. Pap. 73, 84–98. doi: 10.1016/j.dsr.2012.11.007
Brugnoli, E., Molina, L., Till, I., Morales-Ramırez, A., and D́ ıaz-Ferguson, E. (2023).́ Oceanographic conditions and mesozooplankton in the North zone of Coiba National Park (Eastern Tropical Pacific), Panama, Central America. Reg. Stud. Mar. Sci. 66, 103136. doi: 10.1016/j.rsma.2023.103136
Bustos Oña, A., Ponce Villao, G., Cárdenas Condoy, J., and Ormaza-Gonzáles, F. (2024). Condiciones Oceanográficas costeras durante febrero 2024. Available online at: https://camaradepesqueria.ec/condiciones-oceanograficas-costeras-durante-febrero2024/ (Accessed September 12, 2025).
Cai, W., Santoso, A., Wang, G., Yeh, S. W., An, S. I., Cobb, K. M., et al. (2015). ENSO and greenhouse warming. Nat. Climate Change 5, 849–859. doi: 10.1038/ NCLIMATE2743
Carr, M. E., Strub, P. T., Thomas, A. C., and Blanco, J. L. (2002). Evolution of 1996– 1999 La Niña and El Niño conditions off the western coast of South America: a remote sensing perspective. J. Geophys. Res.: Ocean. 107, 29–21. doi: 10.1029/2001JC001183
Chaigneau, A., Abarca Del Rio, R., and Colas, F. (2006). Lagrangian study of the Panama Bight and surrounding regions. J. Geophys. Res.: Ocean. 111, C09013. doi: 10.1029/2006JC003530
Chaigneau, A., Dominguez, N., Eldin, G., Vasquez, L., Flores, R., Grados, C., et al. (2013). Near-coastal circulation in the Northern Humboldt Current System from shipboard ADCP data. J. Geophys. Res.: Ocean. 118, 5251–5266. doi: 10.1002/jgrc.20328
- A. Changnon (Ed.) (2000). El Niño 1997-1998: the climate event of the century (Oxford, England: Oxford University Press).
Charcot, J. (1910). “Story of the ‘Pourquoi-Pas’,” in SA Supplements, vol. 69. , 278. Available online at: https://www.scientificamerican.com/issue/supplements/1910/0430/ (Accessed December 15, 2025).
Chinacalle-Martınez, N., Garć ıa-Rada, E., Ló ́pez-Macıas, J., Pinoargote, S., Loor, G.,́ Zevallos-Rosado, J., et al. (2021). Oceanic primary production trend patterns along coast of Ecuador. Neotrop. Biodiv. 7, 379–391. doi: 10.1080/23766808.2021.1964915
CNP (2023). Coastal-oceanographic information. Available online at: https:// camaradepesqueria.ec/condiciones-oceanograficas-durante-septiembre-2023/ ().
CPC (2025). Cold & Warm Episodes by Season. Available online at: https://origin.cpc. ncep.noaa.gov/products/analysis_monitoring/ensostuff/ONI_v5.php (Accessed September 4, 2025).
Crawford, G., Mepstead, M., and Dıaz-Ferguson, E. (2024). Characterizinǵ oceanographic conditions near Coiba Island and Pacific Panama using 20 years of satellite-based wind stress, SST and chlorophyll-a measurements. Mar. Fish. Sci. (MAFIS) 37, 391–411. doi: 10.47193/mafis.37X2024010112
Cucalon, E. (1987). Oceanographic variability off Ecuador associated with an El Niño event in 1982–1983. J. Geophys. Res. 92, 14309–14322. doi: 10.1029/JC092iC13p14309
D’Croz., L., Del Rosario, J. B., and Gómez, J. A. (1991). Upwelling and phytoplankton in the Bay of Panama. Rev. Biol Trop. 39, 233–241. Available online at: https://archivo.
revistas.ucr.ac.cr/index.php/rbt/article/view/24866 (Accessed August 7, 2025).
Dou, J., and Zhang, R. (2023). Weakened relationship between ENSO and Antarctic sea ice in recent decades. Climate Dynamics 60, 1313–1327. doi: 10.1007/s00382-022-
Echevin, V., Colas, F., Espinoza-Morriberon, D., Vasquez, L., Anculle, T., and Gutierrez, D. (2018). Forcings and evolution of the 2017 coastal el Nino off northern Peru and Ecuador. Front. Mar. Sci. 5. doi: 10.3389/fmars.2018.00367
Enfield, D. B. (2001). Evolution and historical perspective of the 1997–1998 El Niño– Southern Oscillation event. Bull. Mar. Sci. 69, 7–25.
ERAS. (2025). ERA Explorer Climate Data Portal. Copernicus Climate Change Service. Available online at: https://era-explorer.climate.copernicus.eu/?lat=-2. 51&lng=-80.07&plot=3
Espinoza-Morriberón, D., Echevin, V., Colas, F., Dıaz, E., Tam, J., Anculle, T., et al.́ (2021). Diferencias entre los impactos en la costa Peruana de los eventos ENOS cálidos y El Niño Costero 2017: vientos, afloramiento, productividad y anchoveta. Bol Inst Del Mar. Del PE. 36, 329–348. doi: 10.53554/boletin.v36i2.34
Fahrin, F., Gonzalez, A. O., Chrisler, B., and Stachnik, J. P. (2024). The relationship between convectively coupled waves and the east pacific ITCZ. J. Climate 37, 2565– 2583. doi: 10.1175/JCLI-D-23-0398.1
Folland, C. K., Renwick, J. A., Salinger, M. J., and Mullan, A. B. (2002). Relative influences of the interdecadal Pacific oscillation and ENSO on the South Pacific convergence zone. Geophys. Res. Lett. 29, 21–21. doi: 10.1029/2001GL014201 Garcés-Vargas, J., Schneider, W., del Rıo, R. A., Mart́ ınez, R., and Zambrano, E.́ (2005). Inter-annual variability in the thermal structure of an oceanic time series station off Ecuado–2003) associated with El Nino events. Dp. Sea. Res. Part I.: Oceanogr. Res. Pap. 52, 1789–1805. doi: 10.1016/j.dsr.2005.05.008
Garreaud, R. D. (2018). A plausible atmospheric trigger for the 2017 coastal El Niño. Int. J. Climatol 38, e1296–e1302. Available online at: https://repositorio.uChile.cl/ handle/2250/152026 (Accessed June 15, 2025).
Glantz, M. H. (2001). Once Burned, Twice Shy? Lessons Learned from the 1997–1998 El Ni˜no (Tokyo-Japan: The Unite Nations University), 294.
Halpern, D. (1987). Observations of annual and El Niño thermal and flow variations at 0°, 110°W and 0°, 95°W during 1980–1985. J. Geophys. Res. 92, 8197–8212. doi: 10.1029/JC092iC08p08197
Hansen, D. V., and Poulain, P. M. (1995). Quality control and interpolations of WOCE-TOGA drifter data. J. Atmos. Ocean. Technol. 12, 900–909. doi: 10.1175/15200426(1995)012<0900:QCAIOW>2.0.CO;2
Huang, Y., Shu, M., Liu, F., Liu, B., Huang, C., and Wang, S. (2025). Nonlinear heterogeneity impact of El Niño-Southern Oscillation on energy markets: A global perspective analysis. Energy 333, 137475. doi: 10.1016/j.energy.2025.137475
IOC (2018). Sixth international XBT science workshop, IOC project office for IODE. Available online at: http://www.iode.org/wr283 (Accessed June 24, 2022).
Islam, F. S. (2025). Assessment of the global climatic impacts due to el nino and la nina events. J. Global Ecol. Environ. 21, 1–26. doi: 10.56557/jogee/2025/v21i39333
Johnson, G. C., and Lyman, J. M. (2022). GOSML: A global ocean surface mixed layer statistical monthly climatology: Means, percentiles, skewness, and kurtosis. J. Geophys. Res.: Ocean. 127, e2021JC018219. doi: 10.1029/2021JC018219
Kent, E. C., Fangohr, S., and Berry, D. I. (2012). A comparative assessment of monthly mean wind speed products over the global ocean. Int. J. Climatol. 33 (11). doi: 10.1002/joc.3606
Kent, C., Scaife, A. A., Seviour, W. J., Dunstone, N., Smith, D., and Ineson, S. (2025). Transition of El Niño to La Niña can be driven by regional perturbations a year ahead. Environ. Res. Lett. 20, 064014. doi: 10.1088/1748-9326/add35d
Kusuma, D. W., Al Ma’rufi, I., and Muslim, M. A. (2018). Spatial interpolation of sea surface temperature using kriging and inverse distance weighting methods in Java Sea, Indonesia. IOP. Conf. Ser.: Earth Environ. Sci. 116, 12031. doi: 10.1088/1755-1315/116/ 1/012031
Le, N. D., and Zidek, J. V. (2006). Statistical Analysis of Environmental Space-Time
Processes (Cham, Switzerland, at Gewerbestrasse 11: Springer). doi: 10.1007/0-387-31143-8
Li, X., Hu, Z.-Z., McPhaden, M. J., Zhu, C., and Liu, Y. (2023). Triple-Dip la niñas in 1998–2001 and 2020–2023: impact of mean state changes. J. Geophys. Res.: Atmos. 128, e2023JD038843. doi: 10.1029/2023JD038843
Li, Z. L., Tang, B. H., Wu, H., Ren, H., Yan, G., Wan, Z., et al. (2013). Satellite-derived land surface temperature: Current status and perspectives. Remote Sens. Environ. 131, 14–37. doi: 10.1016/j.rse.2012.12.008
Li, X., Yu, J.-Y., and Ding, R. (2024). El Niño-La Niña asymmetries in the changes of ENSO complexities and dynamics since 1990. Geophys. Res. Lett. 51, e2023GL106395. doi: 10.1029/2023GL106395
Lübbecke, J. F., Rudloff, D., and Stramma, L. (2019). Stand-alone eastern Pacific Coastal Warming events. Geophys. Res. Lett. 46, 12360–12367. doi: 10.1029/ 2019GL084479
Mangum, L. J., Hayes, S. P., and Toole, J. M. (1986). Eastern Pacific Ocean circulation near the onset of the 1982–1983 El Niño. J. Geophys. Res. 91, 8428–8436. doi: 10.1029/ JC091iC07p08428
Margaritis, G., Kent, E. C., and Foster, G. L. (2025). Intercomparison of satellitederived SST with logger data in the Caribbean—Implications for coral reef monitoring. PloS Climate 4, e0000480. doi: 10.1371/journal.pclm.0000480
Marsh, T. (2011). Atmospheric Moisture, Precipitation, and Weather Systems (Cambridge, UK: Cambridge University Press).
McPhaden, M. J., Zebiak, S. E., and Glantz, M. H. (2006). ENSO as an integrating concept in Earth science. Science 314, 1740–1745. doi: 10.1126/science.1132588 MEI (2024). MEI.v2: NOAA Physical Sciences Laboratory.